Wind Resource Library

Riverside County Near-Ground Wind Resources

Wind Harvest could add 3.65 GW of wind energy to the San Gorgonio Pass

One of the biggest and most legendary wind resource areas in California is the San Gorgonio Pass. Some of the first wind turbines in the state were installed here in the early 1980s. It quickly grew to hold over 600 MW of wind turbines but has had no significant increases in capacity in decades. Yet beneath and around the existing turbines blows one of the world’s best wind resources, all beneath 100 feet above ground level.

Wind Harvest used Underwriters Laboratories’ Windnavigator data to, for the first time ever, map out the near-ground wind resources in the Pass. The analysis shows that 3,650 MW of wind turbines could be installed underneath the current propeller-type turbines in the existing wind farms in the 48 square miles of desert. With turbines like Wind Harvesters, the area could add 11,310,000 MWh of energy output per year to the ~2,700,000 MWh of wind energy produced there now.

This report used the estimated wind speeds at 66 ft (20m) above the ground at 860 locations across the resource area. Most astounding is how strong the wind is near the ground through the bottom of the pass. Wind Harvest could install over 888 MWs of Wind Harvesters in the 6.7 square miles where the near-ground wind speed averages 17mph (7.75m/s), which is more than the ~600MWs installed in the entire pass now.

San Gorgonio Pass Wind Speed map at 65ft agl

Wind Harvester Generation

If fully built out, 48 square miles of land can support 52,150 Wind Harvester sized turbines, each rated at 70kW, 3,600 MW of total capacity. This buildout assumes that rows of near-ground turbines are placed approximately ~230 ft apart with 5 turbines per 312 ft in each row.

Based on the wind speed in each of the zones indicated on the map above, this number of turbines with the power performance characteristics of Wind Harvesters would produce 11,300,000 MWh of electricity per year. The breakdown of energy generation by wind speed area can be found in the table below.

Table 1. Wind Harvester Buildout and Annual Energy Production
Wind speed at 66 ft above ground level 18.5 mph 17.3 mph 16 mph 15.1 mph
Usable land by sq. mile .97 6.7 10.55 9.34
# of Wind Harvesters 1,842 12,683 19,971 17,683
MWs possible 129 888 1,398 1,238
AEP per MW (MWh/yr.) 3,815 3,465 3,115 2,737
Total AEP in wind speed area (MWh/yr.) 491,934 3,076,201 4,354,624 3,387,838
Capacity Factor 44.4% 40.4% 36.3% 31.9%

Pins showing wind speeds in San Gorgonio Pass

Wind speed pins in San Gorgonio Pass

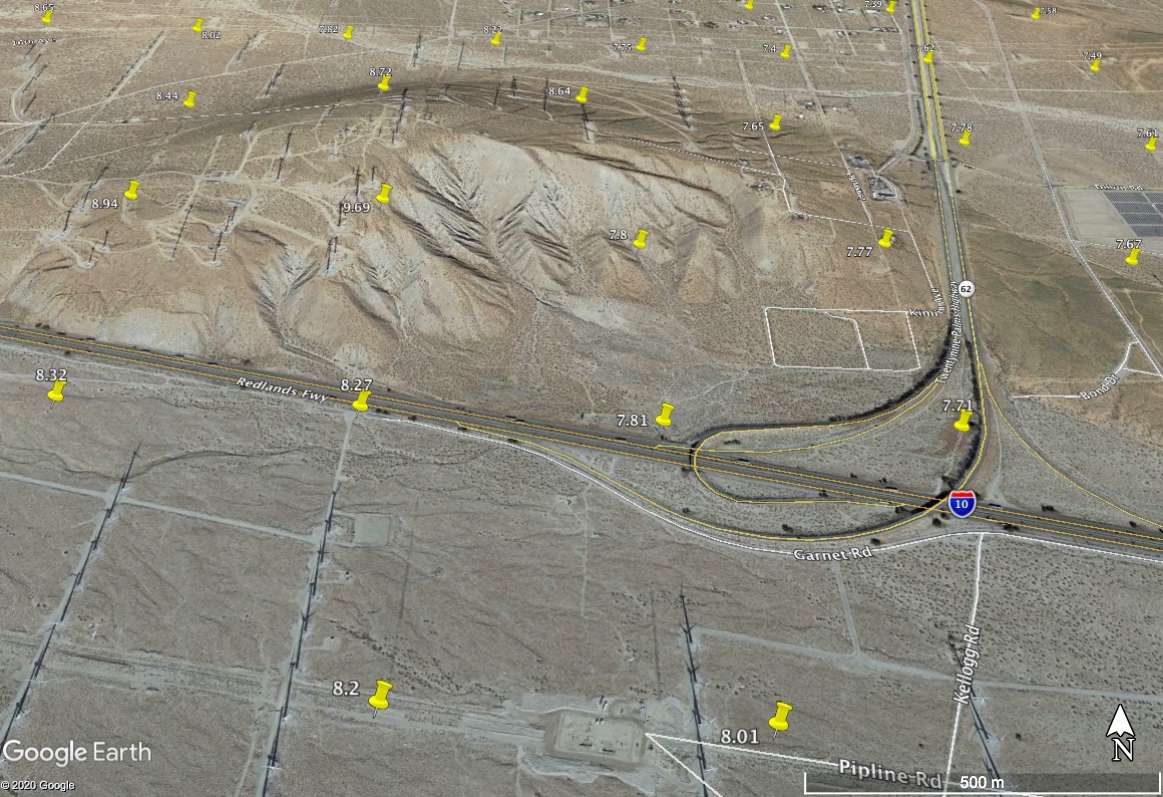
The image above shows a subset of the 860 data points used in this analysis. The wind speeds shown were taken at 66 ft above ground level and are shown in m/s.

Documentation

Table 2. Wind Harvester v3.2 Assumptions for Turbine Density
Rotor Diameter 13m / 42ft 7 in
Distance between turbines in an array 1m / 3ft 3in
# of Turbines per array 5
Length of array 69m / 226ft
Distance between arrays in row 26m / 85ft
Distance between rows 72m / 236ft
MW along linear road 3.68 per km / 6 per mile
# of turbines along linear road 53 per km / 85 per mile
# of turbines by area 731 per sq. km. / 1,901 per sq. mi.
MWs by area 51 per sq. km. / 133.04 per sq. mi.
Table 3. Calculation of Area and Project Size available in Riverside County
Calculations by Wind Speed area (at 66ft/20m agl) Area available for Wind Harvesters # of Turbines Project Size (MW)
Area with wind speed at 17.9 mph (8m/s) and up .97 sq. mi. / 2.52 sq. km. 1,842 128.95
Area with wind speed 16.7-17.7mph (7.5-7.9m/s) 6.7 sq. mi. / 17.35 sq. km. 12,683 887.79
Area with wind speed 15.6-16.5mph (7.0-7.4m/s) 10.55 sq. mi / 27.32 sq. km. 19,971 1,397.95
Area with wind speed 14.5-15.5mph (6.5-6.9m/s) 9.34 sq. mi. / 24.19 sq. km. 17,683 1,237.79
Total over 14.5mph (6.5m/s) available for Wind Harvesters 27.56 sq. mi. / 71.38 sq. km. 52,178 3,652.49
Total Land Area (if 100% was built out) 47.88 sq. mi. / 124 sq. km.
Percent of total land available for Wind Harvesters 58%
Table 4. Annual Energy Production of Wind Harvester v3.2 with Coupled Vortex Effect
Wind Speed Wind Speed MWh/yr/Turbine MWh/yr per MW Capacity Factor
5 m/s 11.2 mph 67 957 10.9%
5.5 m/s 12.3 mph 122 1,743 19.9%
6 m/s 13.4 mph 151 2,157 24.6%
6.5 m/s 14.5 mph 181 2,586 29.5%
7 m/s 15.7 mph 210 3,000 34.2%
7.5 m/s 16.8 mph 235 3,357 38.3%
8 m/s 17.9 mph 260 3,714 42.4%
8.5 m/s 19 mph 285 4,071 46.5%
9 m/s 20.1 mph 310 4,429 50.6%
Table 5. Existing Wind Farms in San Gorgonio Pass – Amounts and Energy Output
Wind Farm Name Wind Farm size (MWs) Wind Speed at 80m agl (m/s) Estimated MWh/year per MW Total estimated MWh/year
Alta Mesa I 18.72 10.69 5,500 102,960
Alta Mesa II 9.45 11.14 5,857 55,350
Altech 3 (b) 21.71 8.46 4,071 88,391
Cabazon 80.67 8.9 4,429 357,253
DifWind I 7.34 8.73 4,071 29,901
DifWind II 3.02 8.65 4,071 12,312
DifWind V 11.77 8.6 4,071 47,929
Dillon 45 8.4 4,071 183,214
Dutch Pacific 10 8.55 4,071 40,714
East Winds 4.2 8.9 4,429 18,600
Edom Hills Repower 20 6.55 2,586 51,714
Energy Unlimited 10 8.46 4,071 40,714
Garnet Wind Project 6.5 8.9 4,429 28,786
Karen Avenue 3 8.9 4,429 13,286
Karen II 4.5 8.9 4,429 19,929
Kenetech 30.3 8.46 4,071 123,364
Meridian Trust 7.55 8.46 4,071 123,364
Mogul Energy 4 8.9 4,429 17,714
Mountain View IV 49 7.9 3,714 182,000
Mountain View Power Partners I 44.4 9.69 4,786 212,486
Mountain View Power Partners II 22.2 8.94 4,429 98,314
Mountain View Power Partners III 22.44 9.22 4,429 99,377
Nestle Waters II 1.85 8.9 4,429 8,193
Nordex Energy 10 9.23 4,429 44,286
Oak Creek – Phase 2A 1.6 8.9 4,429 7,086
Oak Creek Energy Systems 1.35 8.9 4,429 5,979
Oak Creek Energy Systems .8 8.9 4,429 3,543
Oak Creek Phase I (ON-Energy) 4.2 8.9 4,429 18,600
Pacific West I 2.1 8.9 4,429 9,300
San Gorgonio Farms 26 10.15 5,143 133,714
San Gorgonio Farms 2 8.9 4,429 8,857
San Gorgonio Farms repower 14 8.9 4,429 62,000
San Jacinto 5 8.55 4,071 20,357
West Winds 43.4 8.46 4,071 176,700
Westwind-PacifiCorp 1.5 8.9 4,429 6,643
Whitewater Hill 61.5 9.96 5,143 316,286
Whitewater Hill 4.5 8.9 4,429 19,929
Total 616 2,696,519
This file contains pinpoint locations with wind speeds at 66ft (20m) above ground level. The data came from UL’s Windnavigator.

File

Wind Resources Library

For a detailed look at our collection of wind resources, take a look at the library.

Wind Icon
Africa Icon
Asia Icon
Europe Icon
Oceania Icon
South America Icon